This research explores how data and machine learning can be used to investigate patterns within contemporary cities. Using Airbnb data from Berlin, Madrid and Chicago, the project combines spatial analysis with supervised learning to examine relationships between listing characteristics, prices and location.
Rather than using machine learning purely for prediction, the project treats models as analytical instruments: their predictions, limitations and spatial patterns become ways of investigating the urban systems behind the data.
From raw listings to a computational model
Airbnb data brings together very different kinds of information: property characteristics, prices, availability, reviews and accommodation types, as well as missing and categorical values.
Before modelling, the dataset is cleaned and transformed. Missing values are
handled according to what each variable represents, categorical features such
as room_type are converted using one-hot encoding, and logarithmic transformation
is applied to strongly skewed distributions. The independent variables are then
standardised using StandardScaler so that features with larger numerical ranges
do not have a disproportionate influence on the model.
- Airbnb listings
- Price
- Bedrooms
- Room type
- Availability
- Reviews
- Missing values
- Data filtering
- Log transform
- Redistribute skewed variables
- Categorical → numerical
room_type
StandardScaler- Comparable feature ranges
- Processed predictors
- + target variable
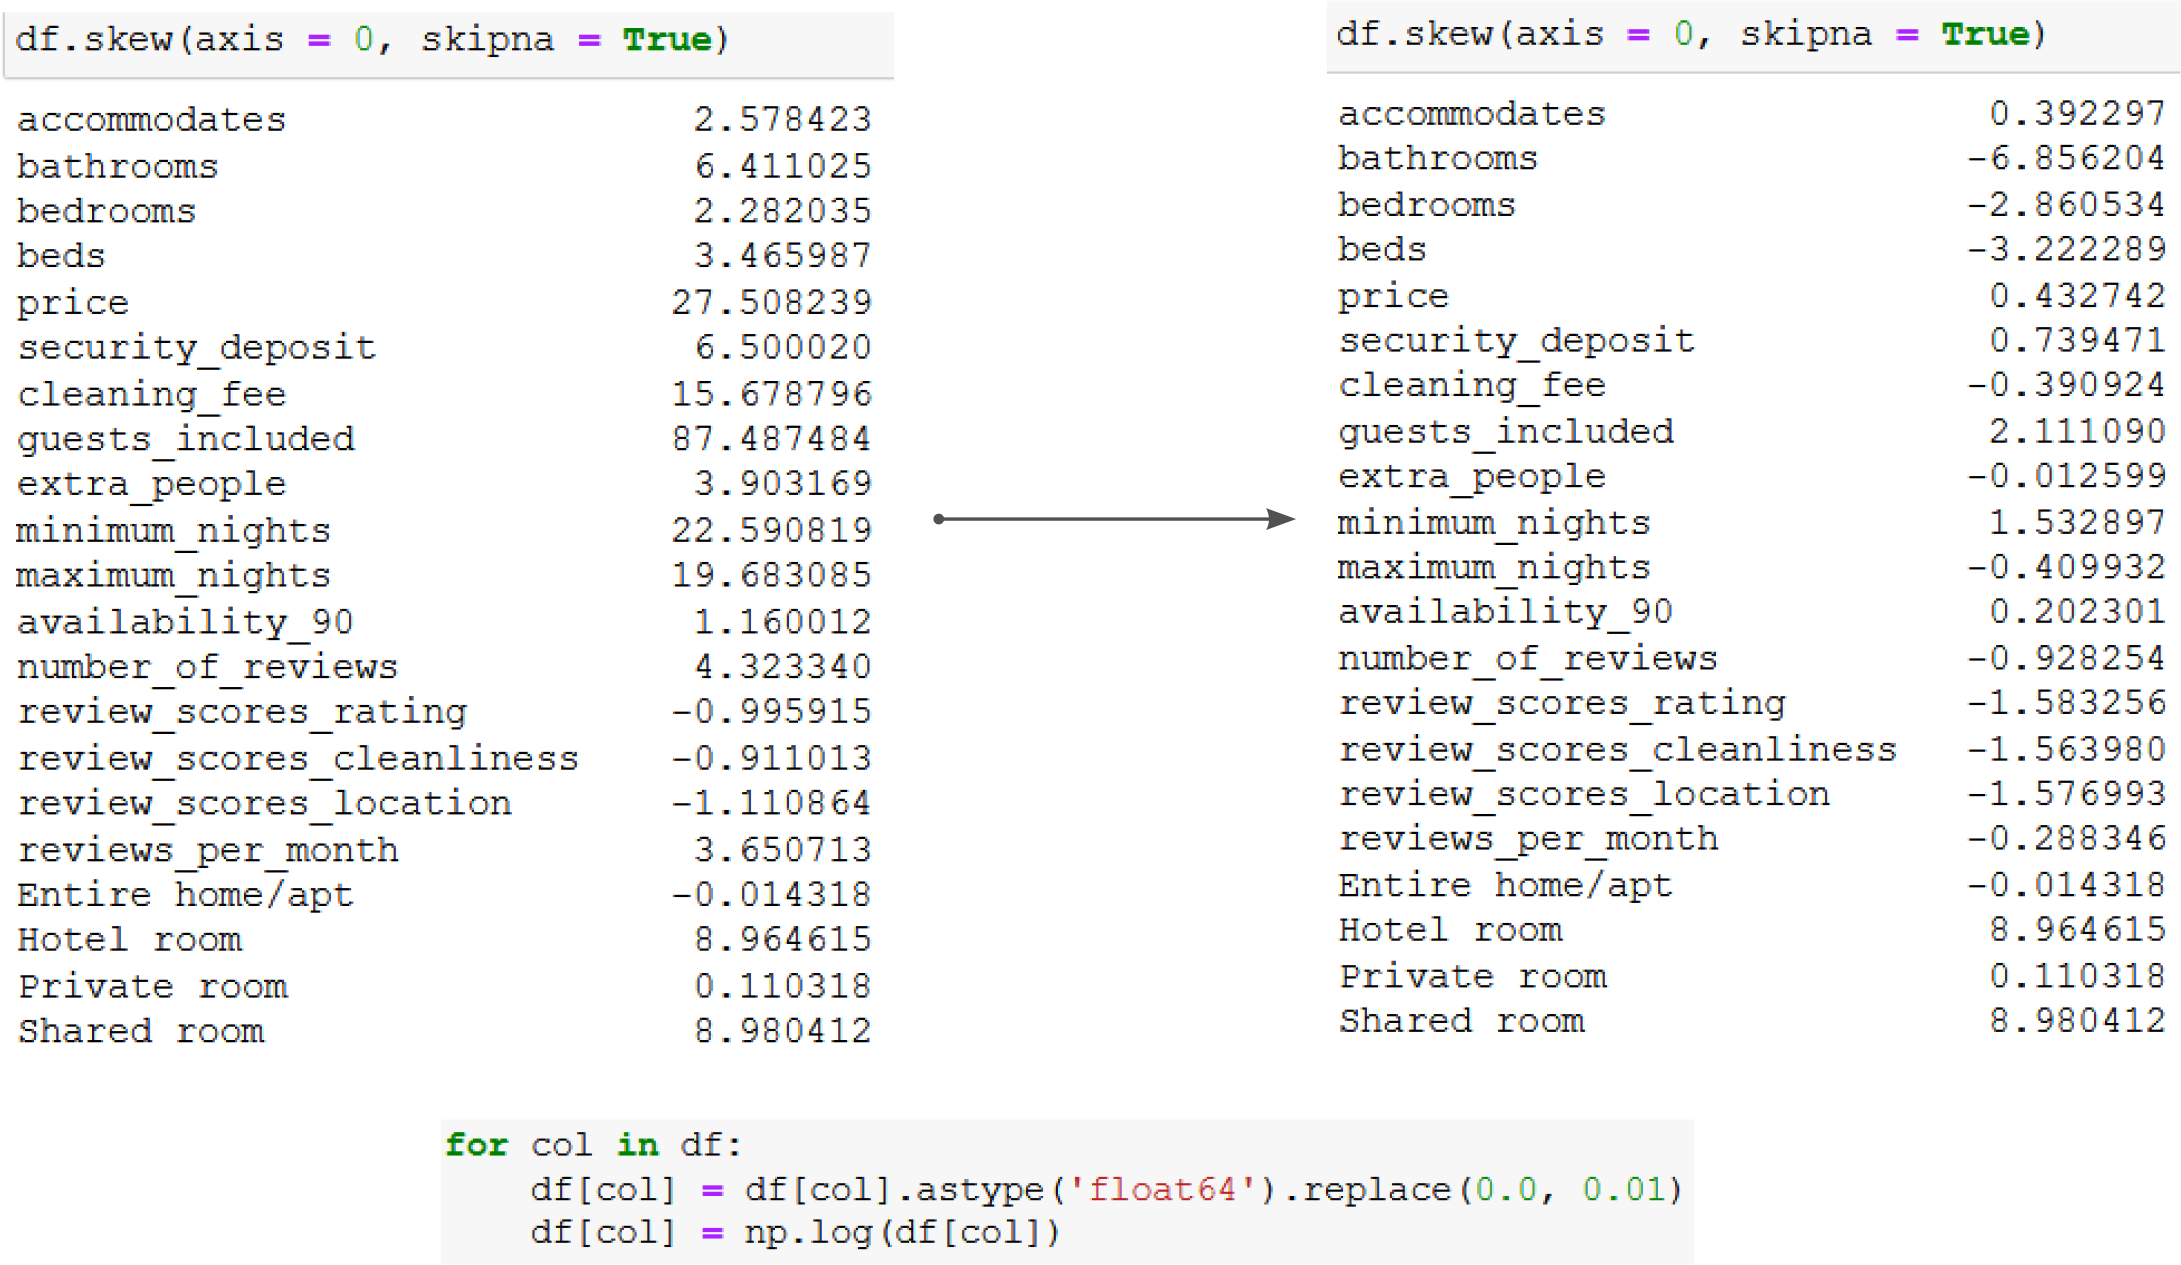
These transformations make very different characteristics of the city computationally comparable. Property characteristics, demand indicators, reviews and accommodation types can then be analysed together rather than as separate pieces of information.
Can listing characteristics explain price?
A K-nearest neighbours regression model is trained to test whether the processed listing characteristics can predict nightly prices.
The dataset is split into 80% training and 20% testing data. Cross-validation is used to test different neighbourhood sizes rather than choosingk arbitrarily, with k = 67 giving the best result for the Berlin model.
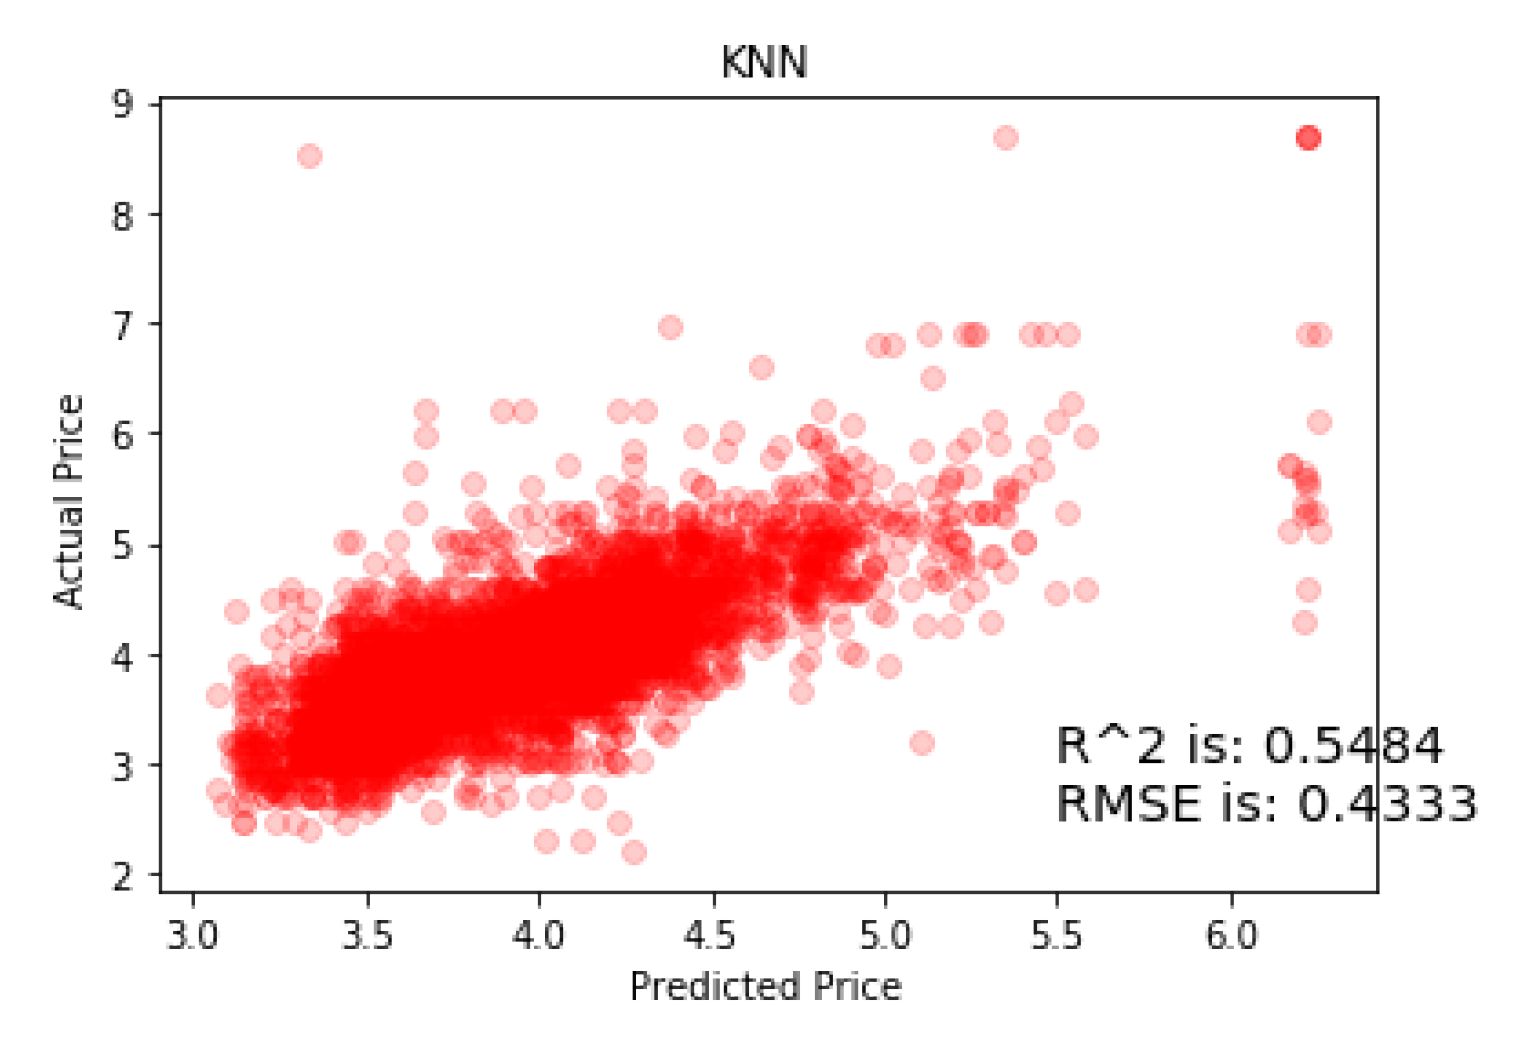
The model explains approximately 55% of the observed variance in price. This suggests that listing characteristics capture a meaningful part of how prices vary, while leaving a substantial amount unexplained.
Are these relationships linear?
To test whether a simpler mathematical relationship could describe the data just as well, the same processed dataset is used to train a linear regression model.
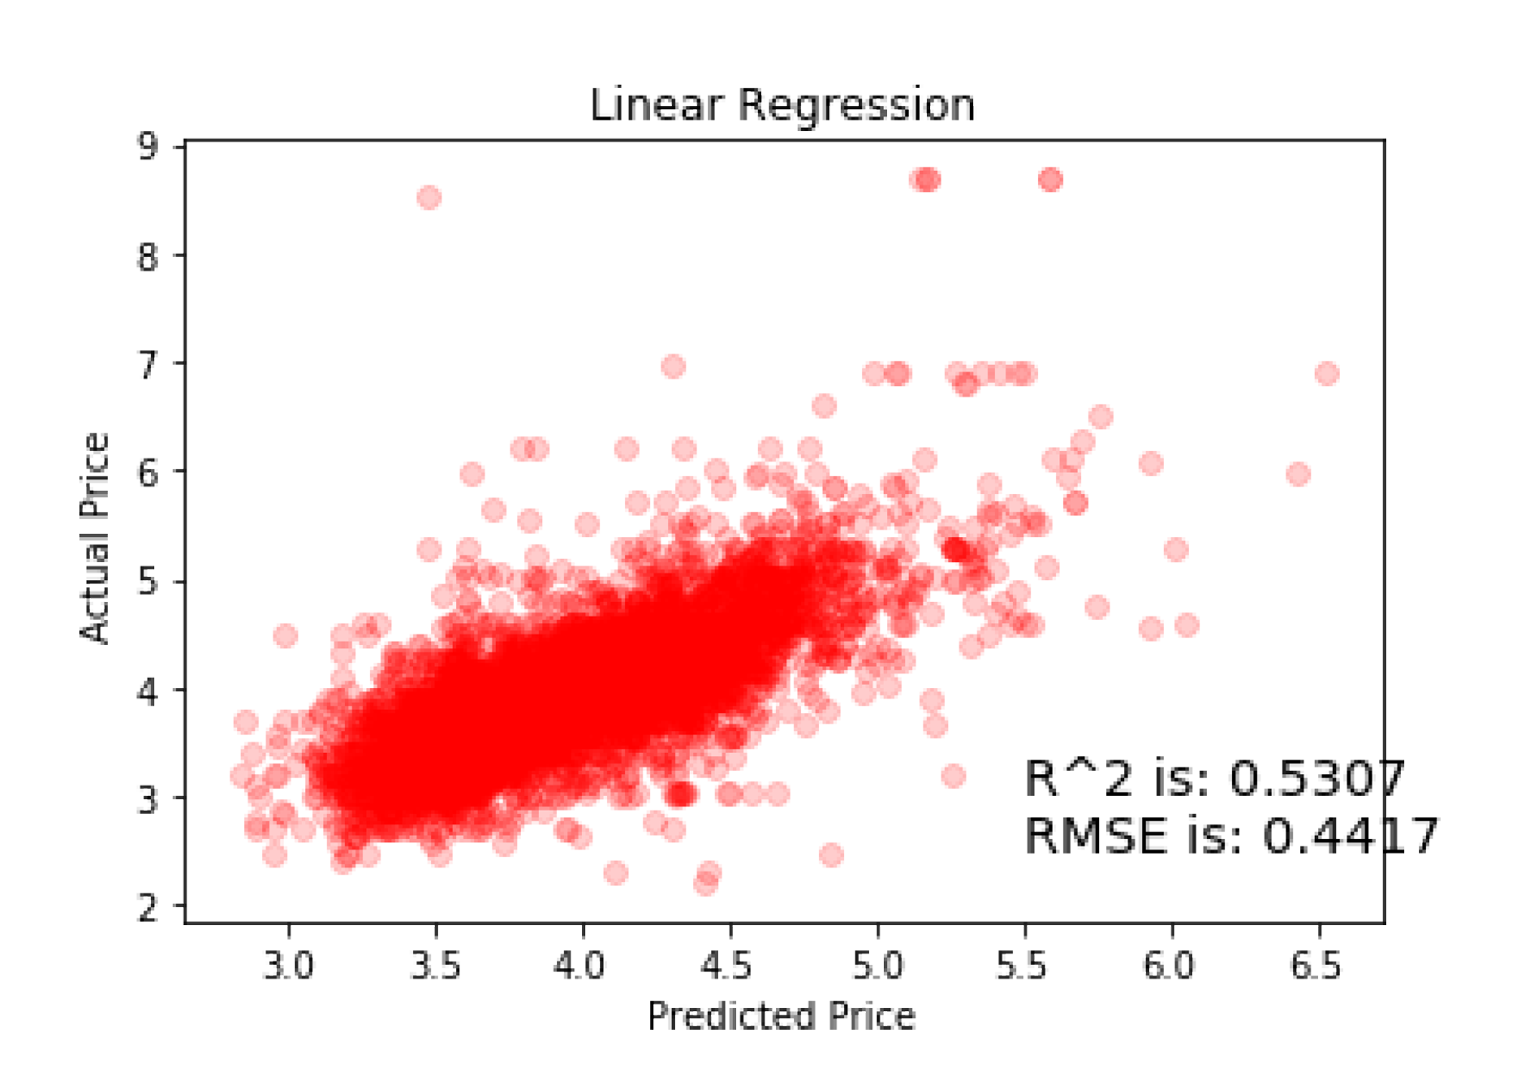
Linear regression performs slightly worse than KNN, with a lower R² and higher prediction error. The comparison suggests that simplifying the relationship to a linear one therefore does not improve the model.
More importantly, comparing the two approaches provides a way of testing how different mathematical representations describethe relationship between listing characteristics and price.
When the same modelling approach is applied to Madrid and Chicago, the results remain relatively similar. Although the three cities are very different, the selected listing characteristics appear to contain a comparable amount of information about price.
COMPARABLE STATISTICAL RELATIONSHIPS · DIFFERENT URBAN CONDITIONS
What urban patterns emerge from the data?
The analysis then returns the data to its urban context. Price, demand, accommodation type and the distribution of Airbnb listings are mapped by district and compared with broader patterns of urban value and tourist activity.
Across the three cities, short-term rental activity intersects with existing patterns of centrality, tourism and socioeconomic difference.
Airbnb activity tends to concentrate around central and highly visited areas, but the pattern is different in each city. Price, demand and accommodation type also take on different spatial distributions depending on the wider urban context.
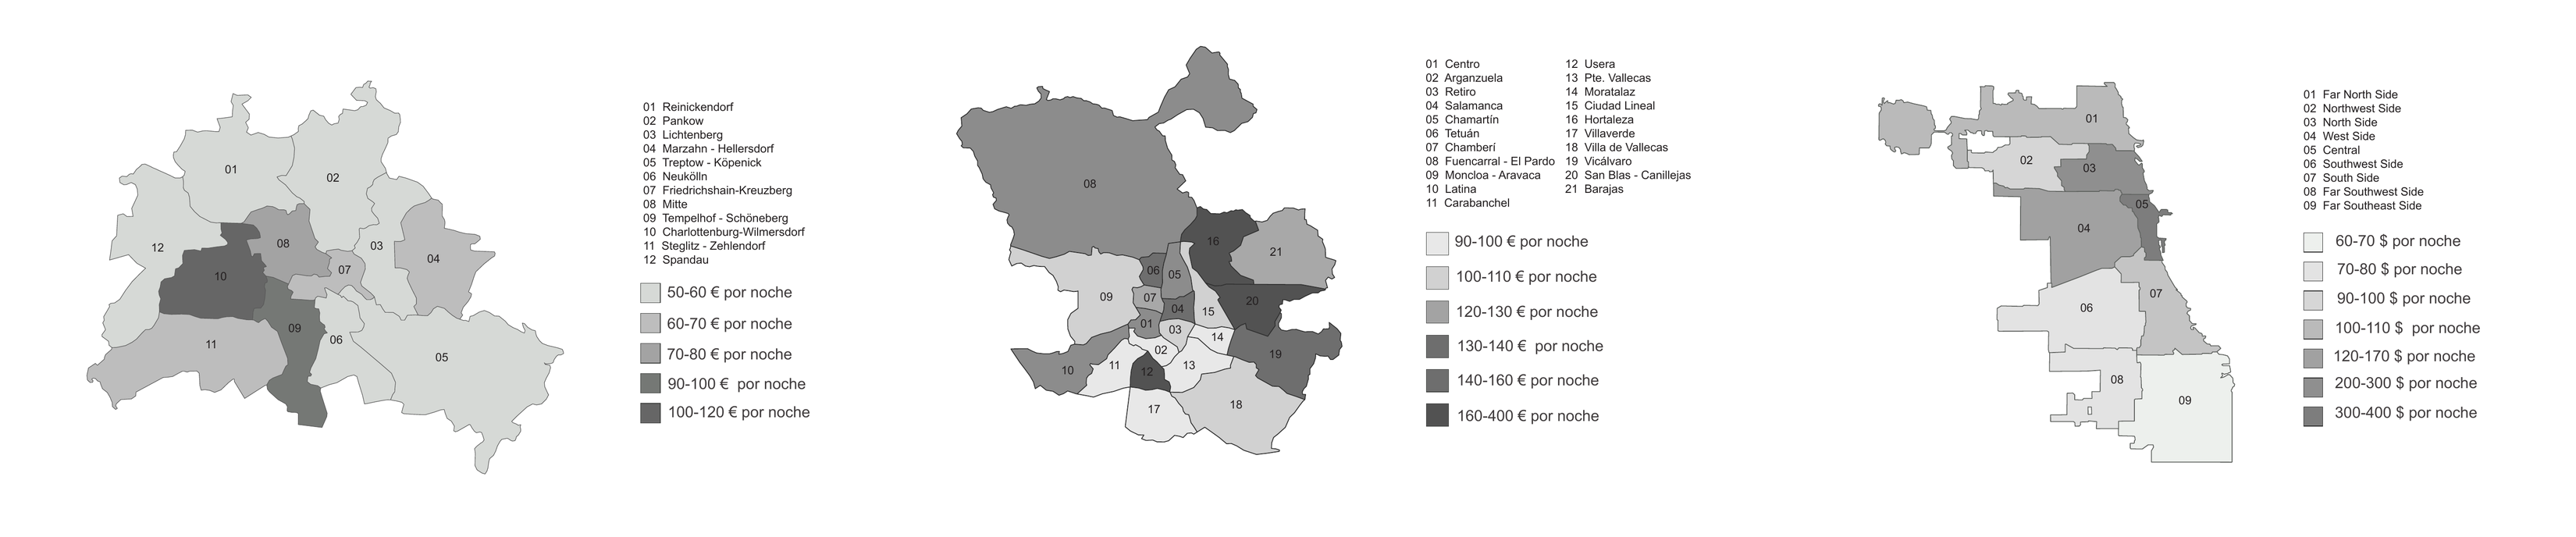
Airbnb prices broadly reflect centre–periphery patterns of urban value, but not in exactly the same way in each city. Berlin and Chicago show higher-price areas around the centre, while Madrid has a more dispersed pattern.
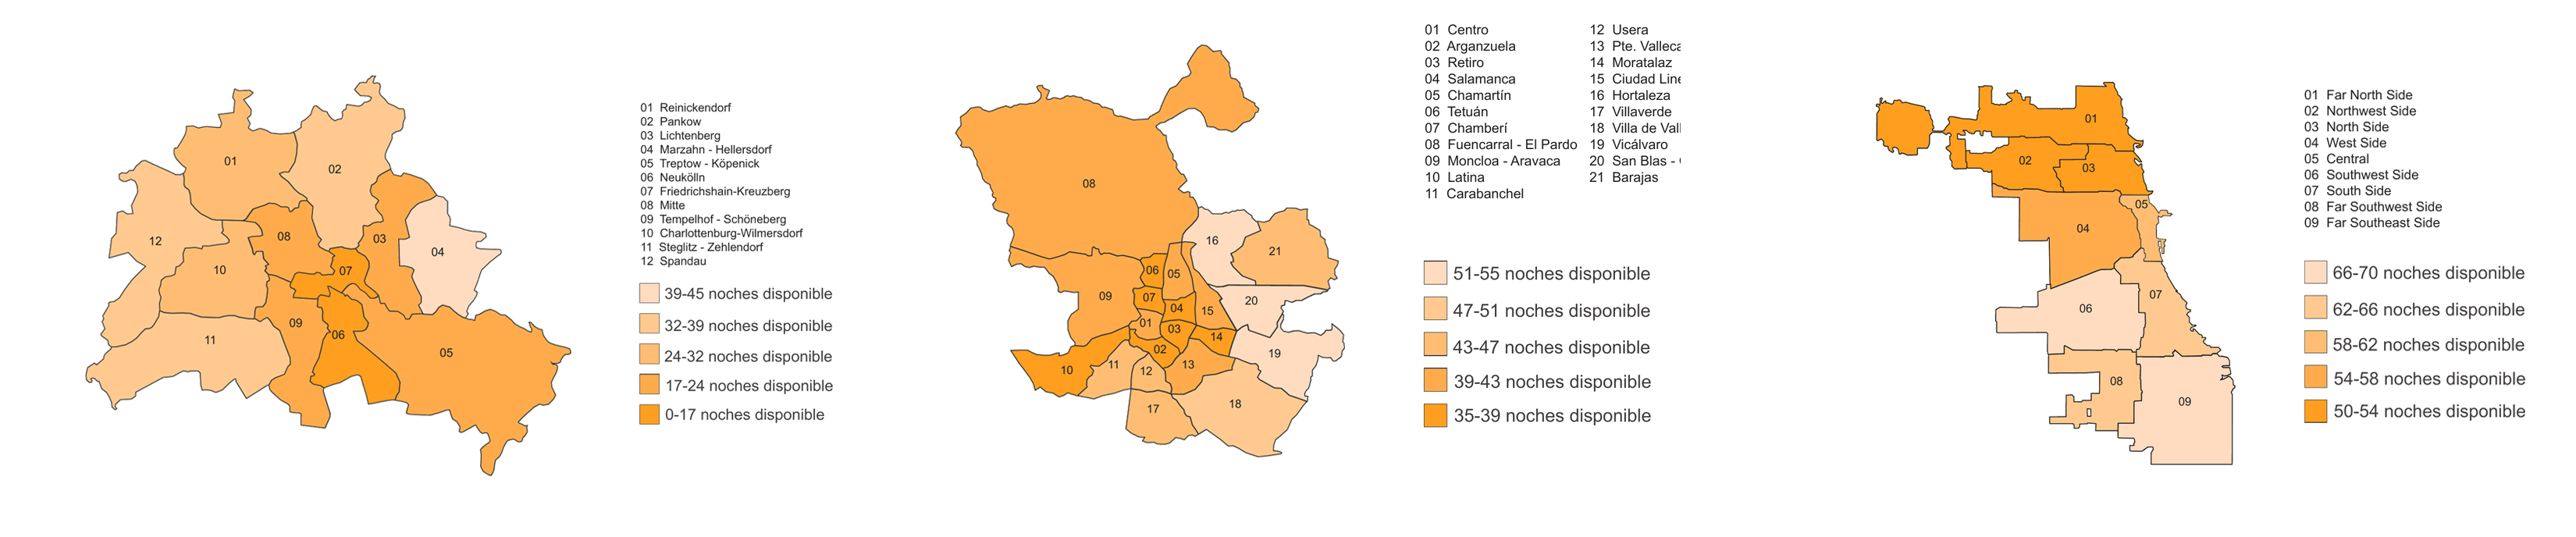
High-demand areas tend to cluster around the centre rather than only within it. In Berlin and Chicago, some of these high-demand areas also overlap with areas identified as exposed to gentrification.
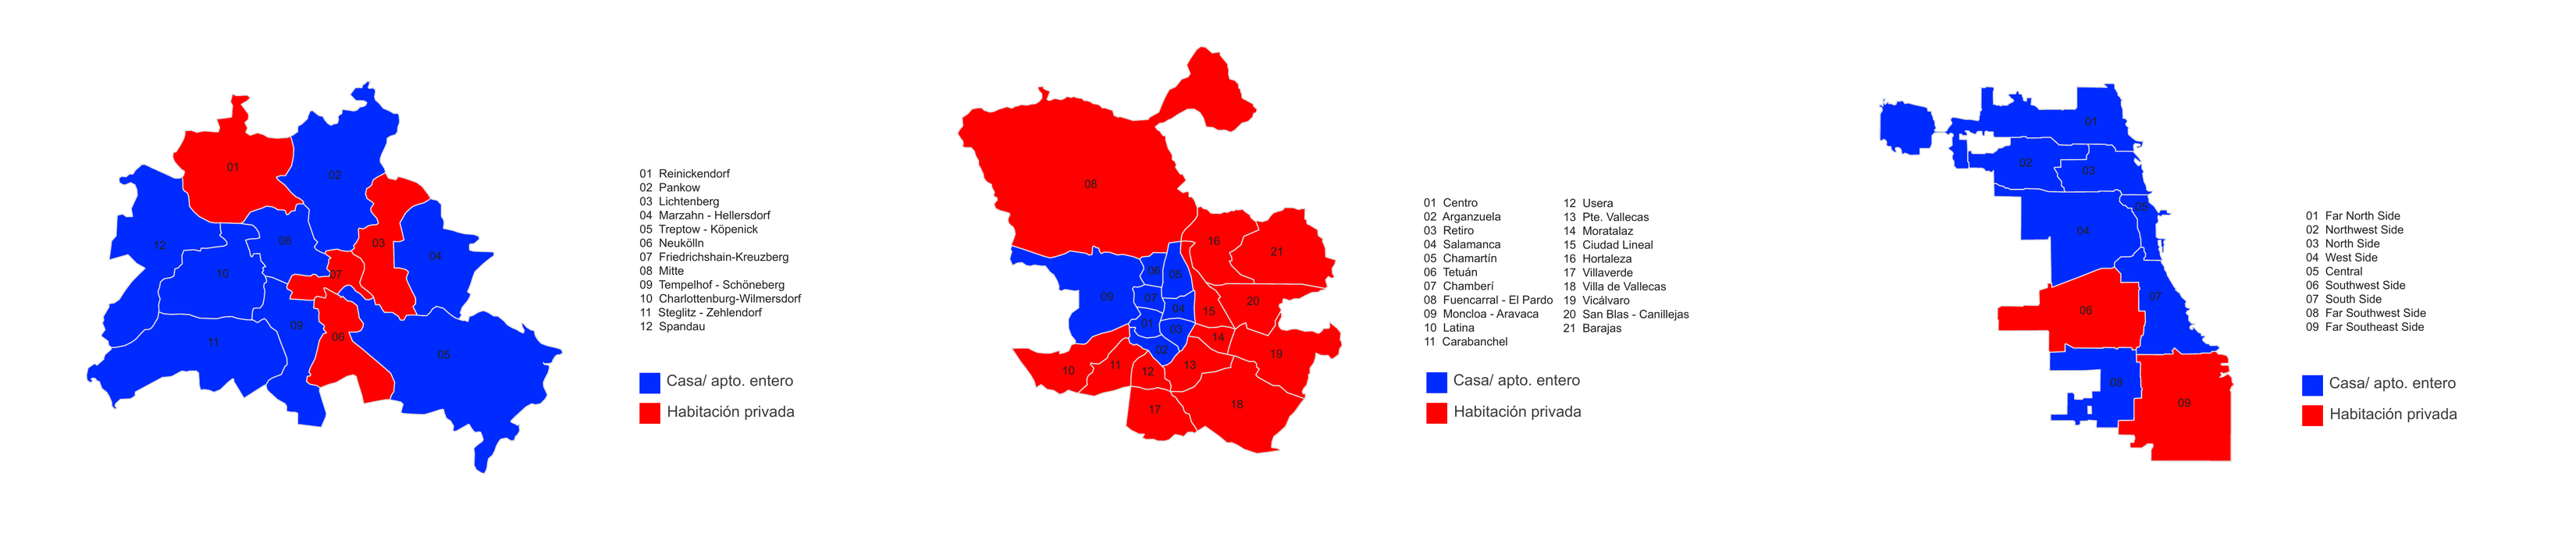
Entire homes and apartments are the most common type of listing in all three cities, but their distribution varies. Berlin has a much stronger presence of private rooms, particularly in areas of higher demand, while Madrid and Chicago show different patterns between central and peripheral districts.
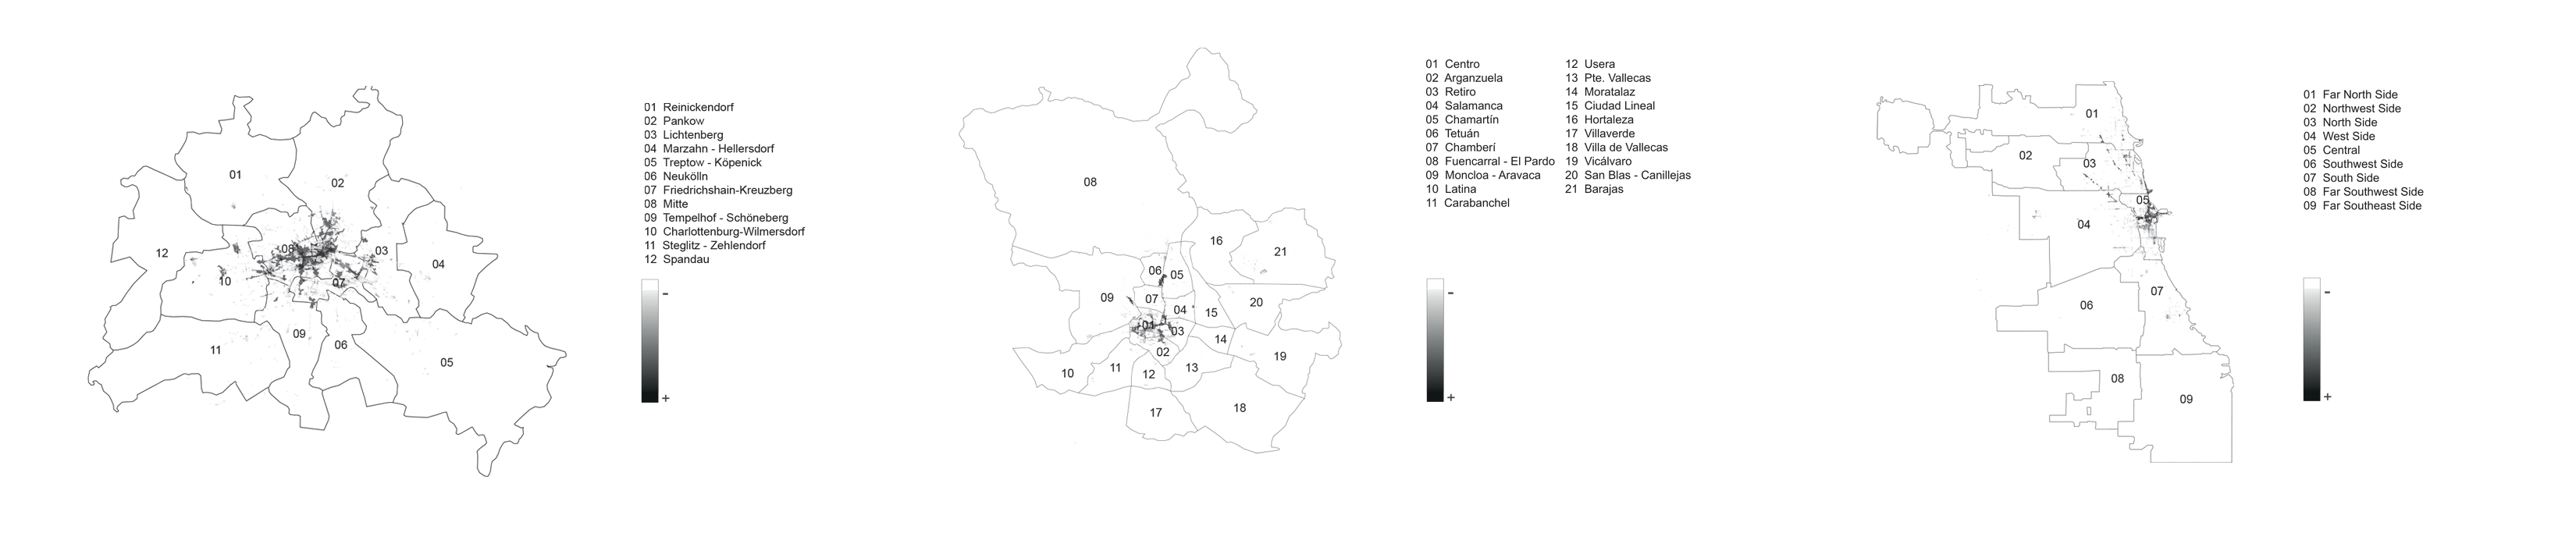
Tourist activity is concentrated in relatively small central areas in all three cities, while Airbnb listings spread further into surrounding districts. The geography of short-term rentals is closely connected to tourism, but is not limited to the traditional tourist centre.
Short-term rentals do not form a separate geography of their own, they interact with existing patterns of value, tourism, centrality and urban change.
Mapping the variables makes it possible to move from statistical relationships to urban ones. Similar relationships in the data can take very different spatial forms once placed back in the context of Berlin, Madrid and Chicago.
From prediction to urban interpretation
Urban Dynamics begins with a relatively simple question can Airbnb prices be predicted from listing characteristics? but develops into a broader investigation of what computational models can reveal about cities.
The project moves between data and urban space: preparing the data, testing relationships through prediction, comparing different models, and finally mapping the variables back onto the cities they describe
DATA → MODEL → EVALUATE → MAP → INTERPRET
Machine learning becomes not just a tool for prediction, but a way of asking questions about complex urban systems.